[Neuromics] MAP-2-A Versatile Neuron Marker
페이지 정보
작성자 다인바이오 작성일13-08-01 09:19 조회4,936회 댓글0건관련링크
본문
MAP-2-A Versatile Neuron Marker
Neuromics is a leader in providing Neuron-Glial Markers for Neuroscientists.
We are constantly on the search for publications that reference use of these markers in unique applications. In this posting I would like to share a publication where researchers used on of our MAP-2 antibodies to stain medial superior olive (MSO) neurons. Baumann Veronika, Lehnert Simon, Leibold Christian, Koch Ursula. Tonotopic Organization of the Hyperpolarization-activated Current (Ih) in the Mammalian Medial Superior Olive. Front. Neural Circuits 7:117. doi: 10.3389/fncir.2013.00117.
...Following recording, slices were fixed in 4% paraformaldehyde for 30 min. After extensive washing in phosphate-buffered saline (PBS) slices were exposed to blocking buffer (0.5% trition X-100/0.1% saponin/1% BSA in PBS) followed by incubation with the primary antibody (chicken anti-microtubule-associated protein 2, MAP2, 1:1000, Neuromics) in blocking buffer. Slices were then rinsed in washing buffer (0.5% Trition X-100/0.1% saponin in PBS) and immunoreactivity was visualized by incubating the slices with the Cy3-conjugated secondary antibody raised in donkey (1:300; Dianova). Finally, slices were washed and mounted on slides with vectashield mounting reagent (Vector Laboratories, USA)...
Here the MAP-2 antibody is used to help identify the dorsal, medial and ventral portion of the MSO of p18 and p22 gerbils.
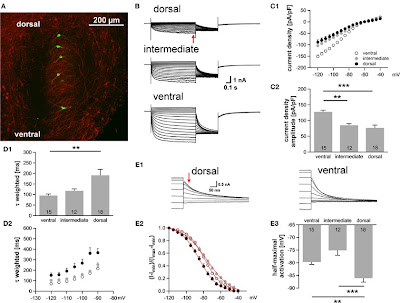
Figure . Ih varies systematically along the dorsoventral axis. (A) A brain slice containing the MSO with Alexa-488-filled neurons (green) verifies the distribution of the patched neurons along the dorsoventral axis (red: MAP-2). (B) Pharmacologically isolated Ih current traces were elicited by depolarizing and hyperpolarizing voltage steps from −60.5 mV to potentials between −40.5 mV and −120.5 mV for 1 s in 5 mV step increment and then to −100.5 mV for 0.5 s to elicit the tail current to determine the voltage dependence of Ih activation. Current traces are representative for the dorsal, the intermediate and the ventral part of the MSO. (C) I-V relationships of steady-state (red arrow in B) Ih density for ventral (n = 15), intermediate (n = 12) and dorsal (n = 18) neurons emphasize that Ih density amplitudes are smallest in dorsal neurons and largest in ventral neurons (C1). Ih density amplitudes for a voltage step to −110.5 mV (C2). (D) Weighted activation time constants at −110.5 mV (D1). The weighted activation time constants are voltage dependent and largest in the dorsal part of the MSO (D2). (E) The voltage-dependence of Ih activation was measured from the tail current 20 ms after the end of the voltage steps (red arrow) (E1). Values were fitted with a Boltzmann function to obtain the half-maximal activation voltage. In dorsal neurons the Ih activation curve is shifted to more negative voltages (E2). Half-maximal activation voltage was measured in each experiment and averaged (E3). Black symbols: dorsal neurons; gray symbols: intermediate neurons; white symbols: ventral neurons. **P < 0.01, ***P < 0.001, single-factor ANOVA test followed by a Scheffe's post-hoc test.
논문 명: Tonotopic organization of the hyperpolarization-activated current (Ih) in the mammalian medial superior olive
Front. Neural Circuits, 11 July 2013
Astrocytes, Glia, Microglia, Olidogodendrocytes, Progenitors and Schwann Cell Markers | |
| Glial-Astrocyte Markers | Neural Progenitor Markers |
| Neuron/Synapse Markers | Oligodendrocyte, Oligodendroglial Oligodendrocyte Lineage Markers |
| Schwann Cell or PNS Neuronal Markers | |
Total 30건
2 페이지